|
|
First Modifications
David L. Ralph
23 Oct 2001
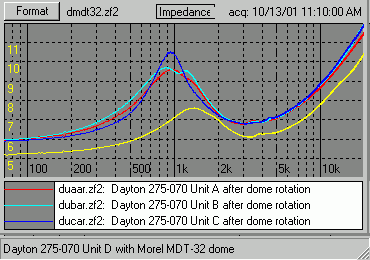
The impedance plots (graph 1) didn't change a lot in doing this, although the three good ones are now all centered at 950hz, very uniform. The magnitudes are reasonably close as well. The variation at Fs is probably not of much importance given where it is. Below 2khz, the variation may cause some slight difference with the crossover, but I suspect not a lot, unless a low order is used.
Note that above 2khz, they are almost all identical, enough that there won't be any variation with the crossover (as far as the impedance is concerned, anyway).
My earlier measurements had some significant noise in them, though this didn't prevent seeing the trends. Modelling in a CAD program also gets rid of this. My setup is better isolated now, but there is still some noise. I used the MLS signal for these. The swept sine wave (stepped, actually) did not pick it up, I suppose because the frequency steps were not exactly at any multiple of 60hz. Note the fundamental 60hz plus the 2nd harmonic (fairly low at 120hz), the 3rd, 5th, 7th, 9th, 11th and even a very small 13th harmonic. I'm guessing that this is either from the internal power supply or I need to move the PC if I'm to eliminate this. It shouldn't be a problem for speaker testing purposes unless distortion measurements are to be made.
There are two problem areas, these at 350hz and 450hz. They are due to some form of resonance, the origin of which I don't know, probably a resonance in the dome/voice coil combination.

|
|
The new version of the Dayton (the only one of two I have which I've tested) doesn't look good. This is counter to the accolades others are reporting after listening to them. My unit may just be an anomoly. I will add tests of the second unit later (when I can find which box it's in, as I just moved!).
These Daytons appear to be a hybrid. They look like the MDT-29 motor (no chamber) but the dome/faceplate is very close to the MDT-32. That's how I got the idea to try a replacement dome, to see how much influence there is in it. The graph shows the importance of the dome/voice coil combination. The MDT-32/33 dome is the only one which can be used as it is the only one with the voice coil connectors attached to the dome assembly. The MDT-29 and -30 have the voice coil connectors attached to the motor assembly top-plate.

|
 |
To this end, I attached a small plastic-cased accelerometer to the faceplate of several of the drivers. Two conditions were tested, one with the driver unmounted and on its back plate lying flat and the other with the driver mounted in a very small, 1.5" thick small baffle lying on its back. The results for Unit C (an original version) are shown, both a frequency response and CSD (waterfall) plots. The differences are striking.

|
In the first few micro-seconds the signal looks identical. From there the two diverge drastically. At first they just look like variations in resonances. By the time they reach 5 msec, it's obvious that the baffle is damping the ringing which continues in the unmounted situation. The time-limited frequency response curve is shown below.
 |
We can get a better idea of what is happening by looking at the accelerometer CSD (waterfall) plots (on the next page). This will let us see what the resonances are doing over time.
| Getting Started | First Measurements | First Modifications | Accelerometer CSDs |