I experimented with the Liberty Instruments Audiosuite (LAUD) measurement system and the speaker CAD software CALSOD by Audiosoft. The following is my experience with the software in trying to obtain the minimim phase response.
I had paid little attention to the minimum phase of a driver in CALSOD for several years. I had assumed that what I had was adequate. It generally was good enough, as I usually use 4th-Order crossovers, which are much less susceptible to phase inaccuracies. The CAD software generates the phase from the SPL anyway, so I figured that what I had was OK. I have recently come to realize that I could do better.
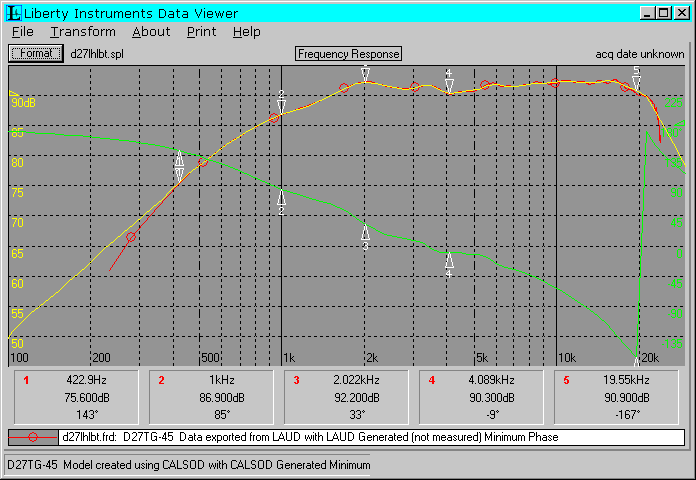
The graphs which follow are from a measurement of a Vifa D27TG-45. The first one is the model as created in CALSOD, using the measured SPL on-axis response, which is overlayed in red.
 |
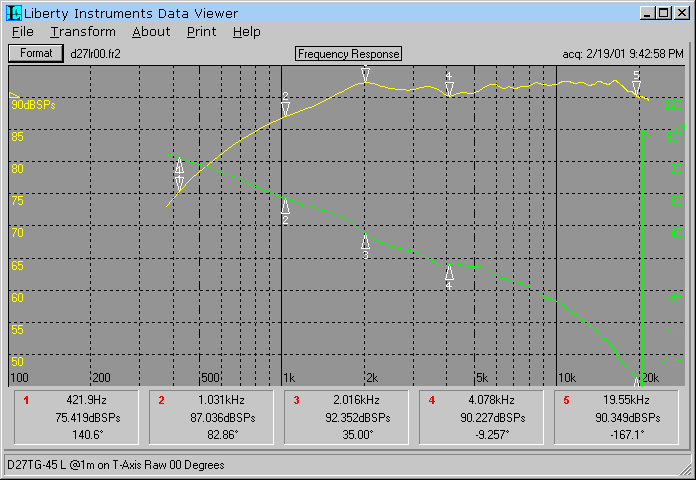
Compare the CALSOD phase above with the measured and delay-adjusted phase in the graph below. Note how well the CAD software can re-create the minimum phase (when the magnitude response is accurately modelled). The two phase graphs are nearly identical. I set the five available markers on each graph to some specific frequencies so that the SPL magnitude and phase can be easily compared. The closeness between the CALSOD generated phase and the LAUD unwrapped measured phase is clear. The difference never exceeds 2.5 degrees. The only real difference is the angle of the line where the phase crosses -180 degrees. This is simply due to the number of sample points used in CALSOD (just over 100 points total).
 |
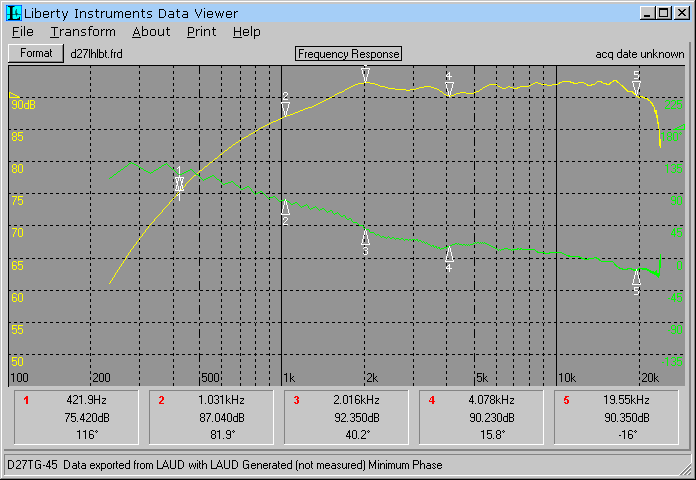
Now compare the delay-adjusted phase above with the phase shown below as generated from within LAUD on the same raw measurement. Note the large difference between the two.
 |
It is sometimes necessary and is at times advantageous to generate phase from the SPL data. This requires that the SPL be accurate and of sufficient range. The lower and upper rolloff are important. Any limitation will introduce errors. The problem with LAUD is the Fiji sound card sampling frequency of 48khz. This limits the upper range of tweeters to the cutoff at 23,906 hz, which is not sufficient to adquately reproduce the minimum phase due to their upper rolloff starting at or above 20khz. The software is not the problem, the SPL data limitation is.
Follow the first link below for a full step-by-step procedure for importing SPL and phase data and matching the model to the measured phase.
